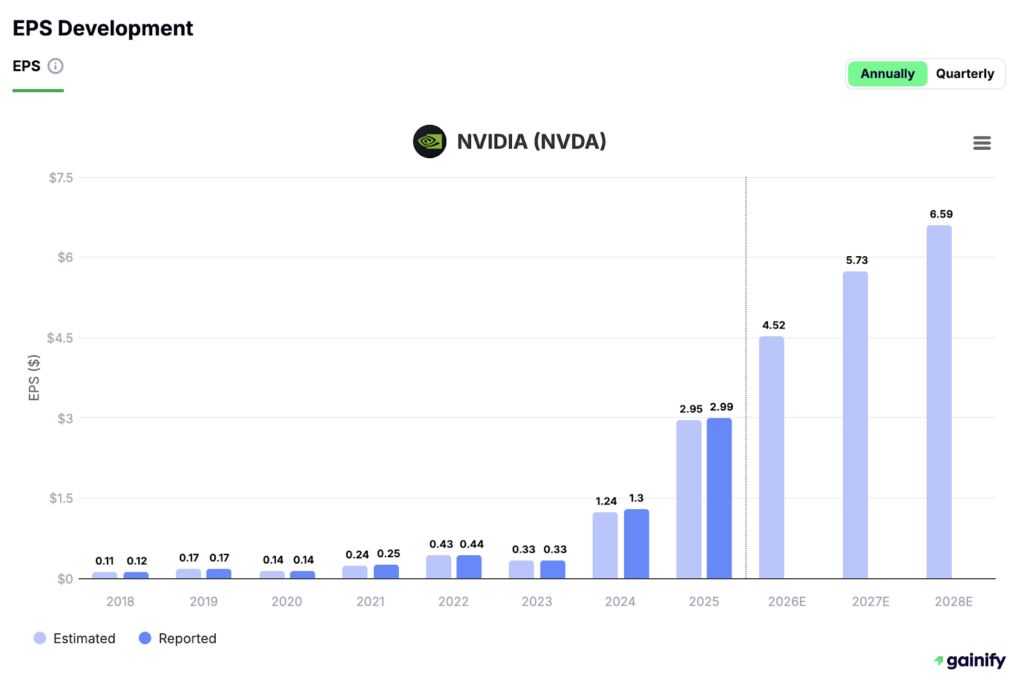
Earnings Per Share (EPS) is a cornerstone of financial analysis and equity valuation. It measures a company’s ability to generate profits attributable to each outstanding share of common stock. While it may seem simple on the surface, EPS has multiple layers of complexity that are critical for institutional investors, equity analysts, and serious individual investors to understand.
This guide offers a deep dive into EPS: its definitions, nuances, classifications, and strategic implications in financial modeling and valuation.
What is EPS mean?
Earnings Per Share (EPS) is a financial metric that indicates the portion of a company’s profit allocated to each share of common stock. It is widely used to evaluate corporate profitability and plays a foundational role in valuation metrics such as the Price-to-Earnings (P/E) ratio or Return on Equity.
EPS provides a standardized way to assess how much profit a company generates on a per-share basis, which is especially useful when comparing performance across companies and sectors.
The two most commonly referenced EPS figures are Basic EPS and Diluted EPS. Each offers a different lens through which to understand a company’s earnings power and capital structure impact.
📐Basic EPS
Basic EPS provides a straightforward view of earnings per share without accounting for potential dilution.
Formula:

Where:
Net Income: Bottom-line profit available to shareholders.
Preferred Dividends: Subtracted because they are not available to common shareholders.
Weighted Average Shares Outstanding: Adjusted for share changes during the period.
📐Diluted EPS Formula
Diluted EPS is a more conservative and comprehensive measure that incorporates the potential impact of securities that could convert into common stock, such as stock options or convertible debt.
Formula:

Where:
Dilutive Potential Shares: Includes stock options, convertible debt, restricted stock.
Why EPS Matters in Equity Valuation
EPS is one of the most integral metrics in the toolkit of equity investors, financial analysts, and institutional asset managers. It serves as a standardized gauge of per-share profitability and plays a pivotal role in assessing value, tracking performance, and guiding investment decisions.
Here’s why EPS is so essential:
- Valuation Benchmark: EPS is the denominator in the Price-to-Earnings (P/E) ratio, one of the most widely used valuation multiples. The P/E ratio helps investors assess how much they are paying for each unit of earnings. A higher EPS can reduce a company’s P/E multiple, suggesting potential undervaluation if share price remains constant.
- Earnings Growth Tracking: Consistent and growing EPS over time is a hallmark of financially healthy, well-managed companies. Accelerating EPS growth often drives stock price appreciation and signals strong business momentum.
- Impact on Dividend Policy: EPS is a key factor in determining a company’s capacity to pay and grow dividends. A high or rising EPS gives companies more flexibility to increase payouts or reinvest in growth initiatives. Conversely, declining EPS may limit future dividend potential.
- Market Sentiment and Volatility: Quarterly EPS results often influence short-term market sentiment. Earnings “beats” or “misses” relative to consensus EPS forecasts frequently move stock prices and trigger revisions in analyst ratings.
Ultimately, EPS is a bridge between a company’s financial performance and its market valuation. While it should never be viewed in isolation, it remains one of the most insightful indicators of shareholder value creation and business strength.
EPS in Financial Reporting (GAAP vs Non-GAAP)
Understanding how EPS is reported under accounting standards is essential for interpreting earnings quality and comparability across companies.
Under GAAP:
- Presentation Requirement: Public companies are required to report both Basic and Diluted EPS on the face of the income statement.
- Operational Segmentation: EPS must be separately disclosed for continuing operations, discontinued operations, and overall net income, enhancing clarity on sources of earnings.
- Reconciliation Disclosures: SEC regulations require detailed reconciliation of basic to diluted EPS, including the calculation of dilutive instruments and their impact on share count.
- Comparability and Auditability: GAAP EPS is standardized and subject to external audit, providing a reliable benchmark across companies and industries.
Under Non-GAAP (Adjusted):
- Management Discretion: Adjusted EPS is commonly used in earnings releases, conference calls, and investor presentations. It reflects management’s view of core operating performance.
- Adjustments Applied: Non-GAAP EPS may exclude one-time items such as:
- Restructuring charges
- Impairment losses
- Litigation expenses
- Stock-based compensation
- Gains or losses from asset disposals
- Pros and Cons:
- Pros: Helps highlight underlying performance by removing non-recurring or non-operational noise. Useful in growth stories or during turnaround phases.
- Cons: Lack of standardization across companies can hinder comparability. Adjusted EPS can be subjective and prone to earnings management.
- Regulatory Scrutiny: The SEC mandates that companies presenting non-GAAP EPS must also show the corresponding GAAP figure and explain adjustments. This is to prevent misleading representations of financial health.
While adjusted EPS provides useful insights into operational performance, it must be interpreted with critical judgment and always compared against the company’s GAAP results.
Limitations and Pitfalls of EPS
While EPS is a widely recognized and useful measure of profitability, it comes with important limitations that analysts and investors must consider:
- Capital Structure Sensitivity: EPS can be distorted by changes in share count. Share buybacks artificially inflate EPS without necessarily improving true profitability, while new share issuance can dilute EPS even when earnings remain unchanged.
- Ignores Balance Sheet Risk: EPS provides no insight into a company’s leverage, liquidity, or capital efficiency. Two companies with identical EPS may have very different financial risk profiles depending on their debt levels and balance sheet strength.
- Earnings Management Exposure: Companies can influence EPS through accounting choices such as accelerating revenue, deferring expenses, or using reserves. These techniques can legally manipulate reported results, making EPS potentially misleading if not supported by strong earnings quality.
- Adjusted EPS Lack of Uniformity: Non-GAAP EPS figures are calculated differently across companies. Management teams have wide discretion in what they include or exclude, making cross-company comparisons challenging and sometimes misleading.
- Variability Across Accounting Standards: EPS results may differ significantly under GAAP versus IFRS or other local standards due to differences in revenue recognition, expense treatment, and depreciation. This affects comparability across regions and jurisdictions.
- Overemphasis on Short-Term Performance: Because markets often react to quarterly EPS surprises, there can be pressure on management to focus on short-term earnings at the expense of long-term strategy and investment.

EPS is a vital part of the financial analysis toolkit but should be interpreted alongside a broader set of metrics, including cash flow, return on capital, and balance sheet health, to gain a holistic view of company performance.
Final Thoughts: EPS as a Decision-Making Tool
EPS remains one of the most essential and widely scrutinized metrics in modern financial analysis. It condenses complex income statement data into a single, per-share figure that reflects the company’s ability to generate profits for its shareholders. Whether used for valuation, profitability assessment, dividend forecasting, or performance benchmarking, EPS is deeply embedded in both fundamental and quantitative investing frameworks.
However, investors should resist the temptation to rely on EPS in isolation. Its interpretation must be informed by a broader view that includes capital structure, cash flow quality, and management’s use of adjustments. Differentiating between GAAP and non-GAAP EPS, and understanding the nuances behind dilution and accounting assumptions, is vital for deriving meaningful insights.
Ultimately, consistent and quality-driven growth in GAAP diluted EPS, adjusted for extraordinary items, signals not just earnings momentum, but long-term resilience and disciplined financial stewardship.


