
Whether you’re building your own financial models or using stock research & analysis tools like Gainify to find your next top investment – having access to reliable stock data is vital for confident investing.
But finding the right financial data source can be overwhelming. The financial data you need for informed investing goes far beyond simple price data, and includes:
- Market data (prices, trading volumes)
- Fundamental data (financial statements, key financial ratios)
- Alternative data (social sentiment)
Your best option is most likely to explore some of the best websites for financial data, such as top stock research platforms like:
- Gainify
- TIKR
- FinChat
- Guru Focus
- TradingView
- Simply Wall St
- Yahoo Finance
Stock analysis tools like these enable you to make intelligent investment decisions backed by high-quality stock data, even if you don’t have a background in finance.
Premium Financial Data Platforms for Retail Investors
Real time stock data from a reputable source such as S&P Global Intelligence (as offered by Gainify, TIKR, and FinChat) is key if you want to be able to make confident investment decisions. Be sure to look for Wall Street grade data in any tool you plan to use for stock analysis.
But the data source is just one piece of the puzzle. Most important is what you can do with this data. Seek platforms that turn complex financial data into clean data visualisations or connect to AI tools for deep stock research.
You shouldn’t have to spend hours crunching numbers and comparing stocks in spreadsheets, let your stock analysis tool do the heavy lifting for you.
Gainify — Best for AI-Powered Stock Analysis and Wall Street Data
The top stock research platform available to retail investors today – with stock screening, top investor tracking, AI stock analysis, and more – is Gainify. You’ll gain access to Gainify AI connected to Wall Street data from S&P Global intelligence – the gold standard in financial data – to cut your stock research time in half.
Gainify AI stock analysis
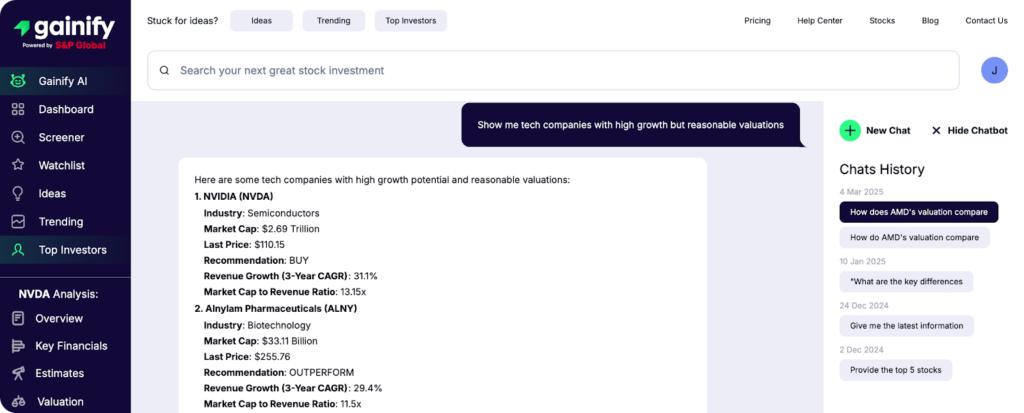
Ask specific investment questions about your stock or industry of interest and receive detailed analysis based on current S&P Global Intelligence data – not outdated information like generic AI tools.
Try stock and industry analysis queries like:
- “How does Square compare to PayPal? What is the outlook for both?”
- “Compare the top players in the electric vehicle industry”
- “What is Gainify’s view on Shopify?”
- “Which companies in the healthcare sector offer the best dividend yields?”
- What insights can we gain from Netflix’s latest earnings call?
You can experience how Gainify AI transforms your investment research with 10 monthly queries on the free plan. Upgrading to the pro tier will get you 500 monthly questions so you never miss a critical market insight again.
Proprietary metrics and analyst estimates database
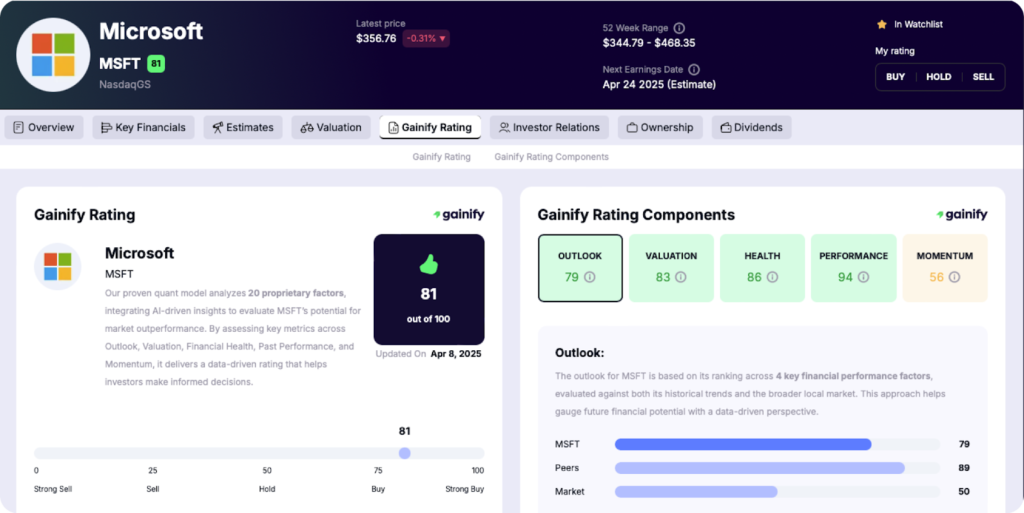
Another strong advantage you will find in Gainify is its proprietary metrics which analyse 5 crucial aspects of a stock’s past, present, and future performance. You’ll gain unprecedented insights into:
- Performance: Evaluates management’s ability to deliver consistent growth and shareholder value based on execution over the past five years.
- Momentum: Measures a stock’s current market strength through 3 price-movement indicators, revealing potential future performance trends.
- Valuation: Assesses whether a stock is undervalued, fairly priced, or overvalued relative to its history and market benchmarks.
- Outlook: Reveals a stock’s expected financial trajectory compared to industry peers and the broader market.
- Health: Shows a company’s ability to weather economic downturns and meet long-term obligations.
All this on top of the world’s largest database of analyst estimates for retail investors – combining deep history of how analyst estimates have evolved over time, with forward-looking projections.
Stock screening

When it comes to stock screeners you have the option of utilising Gainify’s “Stock Ideas” section for pre-built screeners tracking top stocks across the AI, semiconductor, nuclear, cybersec, and other industries (as well as constantly updating a list of stocks that meet key investing criteria such as top dividend stocks, highest Gainify rating, high growth stocks, and more).
You can also utilise customisable screeners which enable you to filter based on industry, country, exchange, and 500+ key financial metrics.
Top investor tracking
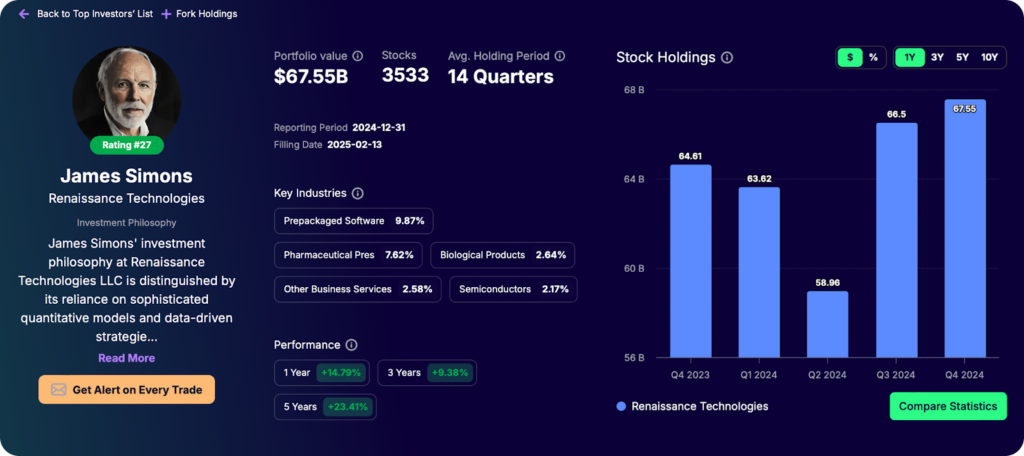
If you’re a retail investor, you likely don’t have a lot of time for stock discovery. Tools like Gainify’s stock ideas, trending stocks, stock screeners, and AI stock analyst can certainly help.
But you can also opt to learn from the pros with top investor tracking. See what top traders and hedge fund managers like Warren Buffet are buying and selling, compare their portfolios head to head, and fork winning portfolios to your own watchlist to keep a keen eye on their performance.
Financial data advantage
Gainfy focuses on providing you with deep financial data on the world’s top 25,000 stocks across 29+ exchanges. It’s Wall Street data combined with best-in-class data visualisation and breakthrough AI capabilities gives you unprecedented insights into a stock’s intrinsic value.
- Industry-wide comparisons powered by analyst estimate data
- Competitor analysis with side-by-side financial metric evaluation
- Historical context by analysing data patterns across multiple years
- Earnings call transcript summaries highlighting key metrics and future outlook
- Up to 15 years of historical estimate evolution data and 3-year forward projections
- Gainify proprietary metrics covering performance, momentum, valuation, outlook, and health
Limitations
- No broker integration for direct trading
- Less historical data depth than some competitors
- No technical analysis charting tools
Pricing
With breakthrough AI stock analysis capabilities available even on the free plan, and ultra-competitive paid tier pricing – Gainfy is the best value for money offering you’ll find. Paid plans are available from as little as $7.99/month, up to $26.99/month (paid annually) for the Gainer Pro tier with 500 AI queries a month.
TIKR — Best for Global Stock Coverage with Terminal-Style Interface
TIKR stands out for its comprehensive stock data – sourced from S&P Global Intelligence. But retail investors may find its numerical and text data heavy interface confusing and difficult to navigate. It comes with a steeper learning curve than a platform like Ganify with its AI stock analysis capabilities and strong data visualisation.
However, TIKR does provide you with more comprehensive global stock data – including over 100,000 stocks across 92 countries (136 exchanges), as well as investor tracking for 10,000+ funds and institutions.
One thing that makes TIKR stand out from many other stock analysis platforms is its Reuters news integration, providing you with the latest updates on stocks as seen by the global media.
If you prefer a terminal-style interface similar to the likes of Bloomberg terminal, then TIKR may be a compelling alternative for you. Although its lack of AI analysis tools and insight-rich visualisations that help you analyse 2x the number of stocks in a fraction of time means it can put you at a disadvantage.
Financial data advantage
TIKR’s primary data source is S&P Global Intelligence (Capital IQ), providing massive global coverage exceeding most retail platforms, including:
- 5 years of analyst estimates
- Up to 20 years of financial history data
- Data on holdings and transactions of 10,000+ funds
- Data on 100,000+ stocks across 92 countries and 136 exchanges
Limitations
- Text-heavy interface with steeper learning curve
- No AI-powered insights or analysis
- Limited visualisation tools
- No technical analysis capabilities
Simply Wall St — Best for Visual Financial Analysis
Simply Wall St provides you with loads of data visualisation options – making it one of the top stock research platforms for visual analysis tools. If you prefer looking at charts and graphs, rather than crunching numbers from tables in a terminal-style interface, then Simply Wall St might be the platform for you.
You’ll be able to analyse over 120,000 global stocks using the Snowflake visualisation. It covers five key areas, highlighting a stock’s performance across valuation, future growth, past performance, financial health, and dividend.
You’ll also likely appreciate Simply Wall St’s visualisations for quick insights into income statements, balance sheets, and cash flows.
If knowing the management behind a company and how much stock they are buying or selling is important for your stock research process, Simply Wall St will deliver. You’ll gain access to compensation, tenure, and share ownership data.
Financial data advantage
While it’s not apparent precisely where Simply Wall St collects its data from (it doesn’t seem to use S&P Global Intelligence like Gainify and TIKR), it does provide broad global stock coverage, including:
- 120,000+ global stocks across 90 markets
- 10 years of historical financial data
- Unique coverage of executive compensation, tenure, and ownership
- Visual representation of financial health across 5 dimensions
Limitations
While Simply Wall St is strong in data visualisation – it lacks the AI stock research tools that many top stock research platforms have to offer today.
- No AI-powered research tools
- Annual-only billing for paid plans
- Limited customisation for advanced investors
Pricing
Simply Wall St offers a free tier with limited access to most features. Paid plans can be accessed for up to $240 annually. You’ll need to pay for a full year upfront as Simply Wall St does not offer monthly payment plans.
Platforms with API Access for Developer-Minded Investors
If you’re a more data-savvy investor with some coding experience, you may be interested in platforms that offer API access to their data & tools. Having API access gives you unmatched flexibility to build your own custom tools, automated research processes, or stock research models.
FinChat — Best for KPI & Segment Data with API Access
FinChat is a top stock analysis platform providing many of the tools modern-day investors have come to expect. Just some of the features you will have access to include:
- Ownership and 13F data
- AI chatbot for financial analysis
- 300+ metrics for stock screening
- Analyst estimates and price targets
- Hedge fund letters and analyst estimates
- Earnings calendar and investor relations content
But that’s not all. FinChat also provides you with company specific KPIs (such as subscribers, renewal rates, and daily active users) and segment data (for example, premium subscription versus ad-supported revenue or geographical breakdowns). You won’t find this kind of nuanced detail available in many other stock analysis tools.
Additionally, as mentioned, you will be able to access much of FinChat’s data via API, including: fundamentals, market data, estimates, reports & press releases, transcripts, and segments & KPIs. Use this for your own research process, or build your own customer-facing solution.
Financial data advantage
Like Gainify and TIKR, FinChat also sources its data from S&P Global Intelligence. In addition to FinChat’s KPI and Segment data, you will have access to:
- Up to 12 years of segment/KPI data and 10 years of financial history
- 300+ metrics for advanced stock screening
Limitations
FinChat has most of the features you will need as a retail investor. But it is lacking in some areas.
- No mobile app
- No broker integration
- Steeper learning curve than more visual platforms
- You can only access some features on premium paid tiers
Pricing
FinChat’s free tier provides much of what you will need to derive investing insights. But for additional data depth and long term forecasts, you will need to upgrade to a paid plan. Prices range from $29/month (Plus) to $79/month (Pro).
TradingView — Best for Technical Analysis
TradingView (like FInChat) also offers a way to code your own solutions. However, while FinChat offers this via its API, TradingView provides you with access to Pine Script – TradingView’s programming language – which you can use to make queries on on the company’s servers.
Additionally, the kind of data and capabilities you will have access to are drastically different – FinChat focuses on fundamentals, whereas TradingView focuses on technical indicators and analysis.
The quickest way to get started with Pine Script is to use TradingView’s community scripts (containing over 150,000 scripts, most of them free for you to use).
When it comes to creating your own scripts, there are three different types you will be able to write:
- Indicators: Such as RSI, MACD, etc.
- Strategies: These include logic to issue trading orders. You can backtest and forward-test on TradingView.
- Libraries: Mostly used by more experienced programmers, these enable you to package often-used functions to be reused by other scripts.
Other TradingView features less commonly available in other stock research platforms, include paper trading capabilities and advanced charting with over 400 built-in indicators.
Financial data advantage
If it’s technical analysis and indicators you’re looking for, TradingView is one of the most compelling choices available today. Get access to:
- Various exchanges and data providers
- Data for stocks, forex, crypto, and commodities
- 150,000+ community-created indicators and strategies
- 400+ technical indicators and built-in pattern recognition
- Comprehensive technical analysis data and visualisation
- Price action, volume patterns, and technical analysis signals
Limitations
TradingView gives you an almost unprecedented amount of information. However, it comes with a steeper learning curve and lacks basic fundamental analysis skills.
- Ads on lower priced plans
- Expensive compared to alternatives
- Steep learning curve for advanced features
- Features heavily restricted on lower-tier plans
- Limited fundamental data compared to other platforms
Pricing
Pricing ranges from $14.95/month for the lowest priced “non-professional” (as TradingView calls it) tier, and ranges all the way up to $239.95/month for the Ultimate tier under the group of “Professional” plans.
GuruFocus — Best for Value Investing
GuruFocus is built with a strong focus on value investing. That means replicating the strategies used by the likes of Warren Buffet, Charlie Munger, Ray Dalio, Bill Ackman, and more.
You’ll find dozens of pre-built value screens, guru trade tracking for top value investors, insider & politician trade tracking, and the latest stock news.
The GuruFocus dashboard is cluttered – there is a lot of raw text data to ingest to gain investing insights. It’s far from the modern streamlined user interface you will find in Gainify. For this reason, the platform has a steeper learning curve and your stock research may be slower.
However, GuruFocus does provide an AI chatbot assistant for faster stock research & analysis. It will even provide you with guru holdings and create screeners for you, right within the chat.
Financial data advantage
GuruFocus provides a few useful advantages when it comes to the financial data you can access, and the formats you can access it in. Not only will you find a large amount of stock data available, GuruFocus also provides direct access to its data via API and an Excel integration.
- Data licencing to purchase full commercial access to GuruFocus data (warning, this costs from $2,500 to $170,000+ per year depending on how much data you want access to)
- Pipe up to 30 years of historical financial data for 90,000 global stocks into excel for more customizable stock research (available only to premium users)
Limitations
You’ll find GuruFocus does have some significant limitations that are hard to overlook. While it is a technically very capable platform, you will be hindered by a complex interface and inaccessible pricing.
- Complex use interface
- Limited free tier capabilities
- Very expensive compared to other platforms
- Global data access requires additional subscriptions and cost
Pricing
While GuruFocus provides you with a wealth of value investing insights, it is unfortunately quite expensive compared to other stock research platforms. While there is a free trial – paid plans require you to purchase data for each global region separately. Global stock coverage can cost up to $4,410 annually.
Alpha Vantage — Best for Beginners with API Needs
If you’re only looking for financial data and don’t need a user interface – then Alpha Vantage may suit your needs. The company offers over 100 types of financial data, including:
- Crypto data
- Commodities
- US options data
- Time series data
- Fundamental data
- Economic indicators
- Technical indicators
To make use of it, you will need to know how to authenticate and make calls to an API, and code your desired stock research & analysis processes.
You can get started for free with an API key, but the data you can access will be limited to non-premium sources. You may also run into rate limit errors because the amount of data you can call from the API will be limited.
Financial data advantage
Comprehensive API data means you can build almost anything you envision. With Alpha Vantage you gain access to:
- 50+ technical indicators calculated server-side
- 100+ distinct data types accessible programmatically
- GDP, inflation, unemployment, and other macroeconomic indicators
- Intraday (1min, 5min, 15min, 30min, 60min), daily, weekly, and monthly
Limitations
Alpha Vantage is great if you’re a finance pro or software developer looking for financial data, and you don’t need a user interface, AI chatbot features, or built in charts and graphs.
- Significant rate limits on free tier
- No analytical tools beyond raw data
Pricing
Premium plans range from $49.99/month for 15 minute-delayed US market data and 75 calls per minute, to $249.99/month for real time US market and options data with 1200 calls per minute.
Free and Low-Cost Options for Financial Data
While many of the tools we have already covered offer very generous free tiers (even including access to AI stock analysis), many do limit how many stocks you can research on the free tier.
For less restricted free stock analysis, you may wish to explore Yahoo Finance.
Yahoo Finance — Most Comprehensive Free Option
Yahoo finance offers real-time quotes for most US stocks, without restrictions on how many stocks you can browse per week or month. You’ll also find comprehensive news across multiple asset classes including ETFs, currencies, and Crypto.
If you happen to be outside of the US, and in Australia for example, Yahoo finance will automatically show you the most relevant stock data from your local exchange(s).
Data available includes analyst estimates, options data, sustainability information, etc. However you may find that not all information is available for some stocks.
Financial data advantage
Yahoo Finance’s main financial data advantage is that it gives you quite comprehensive access to global stocks for free, and there are no strict limits on how many stocks you can view data for each month.
- Real-time market data from 50+ countries and 100+ exchanges
- Up to 40 years of historical data for major stocks (paid plans only)
- Multi-asset data for Stocks, ETFs, mutual funds, bonds, options, futures, currencies, and crypto
Limitations
While the Yahoo Finance free tier is less restrictive than other platforms (you can view more stock reports), the platform does lack key features.
- Few data visualisation options
- Limited forward-looking forecasts
- Advanced features behind paywall
- Intrusive advertising on free version
- Basic analysis compared to other platforms
- No AI chatbot or AI earnings call analysis features
- No deep historical trends for the evolution of analyst estimates
Pricing
As you now know, Yahoo Finance does have a generous free tier. However, to access additional features, you will need to upgrade. Paid plans are available for up to $49.95/month.
Choosing the Right Financial Data Platform for Your Needs
Everyone has different investing goals and styles. It’s important that you choose a stock research platform based on what suits you best – not based on what everyone else seems to be using. We all learn, and analyse stocks differently. The terminal style interface that works for the number cruncher who enjoys analysing swathes of hard text data won’t suit you if you prefer visualisations or AI stock analysis. The best stock research platform is the one that gives you the biggest edge, speeds up your decision making, and helps you become a more confident investor.
You can, of course, use multiple stock analysis platforms to formulate your own personalised stock research process.
Based on our comprehensive analysis in this article, below are some stock analysis platform recommendations for different investor profiles.
When choosing the right financial data source, consider what specific data matters most for your investment strategy:
- Need analyst estimates and forward projections? Gainify offers the most comprehensive database available to retail investors (all connected to its breakthrough AI stock analyst chatbot)
- Want the broadest global coverage? TIKR’s 100,000+ stocks across 136 exchanges is unmatched
- Require granular business KPIs? FinChat’s segment data provides operational insights
- Prefer technical analysis data? TradingView’s 400+ indicators and pattern recognition stands out
- Inspired by top value investors? GuruFocus provides a host of tools and pre-built screeners for investors like you
- Need programmatic access? Alpha Vantage’s simple API structure with 100+ data types delivers
Today there are options for all types of investors. No matter your investing style or asset class of focus, you will find a platform to suit your needs. Today’s investors benefit from democratisation of both premium Wall Street data (for example, Gainify’s integration of S&P Global Intelligence data) and breakthrough AI analysis tools – both previously out of reach for retail investors.
Frequently Asked Questions
How much should I expect to pay for quality financial data?
Free tiers offer basic access. Budget options cost $7-30/month with good value from platforms like Gainify. Premium plans range $30-100/month. Professional solutions exceed $30,000 annually. Most retail investors find everything they need in the $10-30 range.
What’s the advantage of using S&P Global data through platforms like Gainify?
Wall Street-grade reliability at retail investor prices. S&P Global data typically costs institutions $20,000+ annually but is now available through platforms like Gainify with AI tools to extract actionable insights quickly.
Do I need programming skills to make use of financial APIs?
Yes. Financial APIs require basic programming knowledge. If you don’t code, choose user-friendly platforms with visual interfaces like Gainify or Simply Wall St instead.
Which platforms offer the best financial data for AI-assisted research in 2025?
Gainify (for analyst estimates, proprietary valuation metrics focused on intrinsic value, and earnings calls) and FinChat (for KPI and segment data). Their AI tools analyse in seconds what would take hours manually.
Which financial data types matter most for different investing strategies?
Day traders need real-time pricing and news alerts (TradingView, Yahoo Finance Premium). Value investors require fundamentals and analyst estimates (Gainify, Simply Wall St). Quants rely on clean historical data and alternative datasets (Alpha Vantage, FinChat API). Growth investors focus on revenue trends and margin expansion metrics (Gainify, FinChat).