")
Return on Assets (ROA) is a foundational financial ratio used to assess how effectively a company utilizes its asset base to generate net earnings. As a key performance indicator in both equity research and corporate finance, ROA bridges the income statement and balance sheet to reveal how well management converts assets into profits.
From an investor’s standpoint, ROA functions as an efficiency benchmark that transcends company size and capital structure, making it particularly useful when comparing companies across a sector. It provides a standardized measure of how productively assets are being deployed, enabling clearer, data-driven investment decisions.
In this guide, we’ll explain how ROA is calculated, how to interpret it, and why it’s an essential component of sound financial analysis for both short-term evaluation and long-term investment strategy.
What is Return on Assets (ROA)?
ROA is a financial ratio that shows how much net income a company generates for every dollar of assets it owns. It is a key indicator of operational efficiency and is often used to compare companies within the same sector.
How to Calculate Return on Assets:
Net Income: Found at the bottom of the income statement. This is the company’s profit after taxes and expenses.
Average Total Assets: Calculated by averaging the total assets at the beginning and end of the period (usually a fiscal year).
Example: If a company earns $1 million in net income and has $10 million in average total assets, its ROA is:
ROA = $1,000,000 / $10,000,000 = 10%
This means the company earns 10 cents for every dollar invested in assets.
Why ROA Matters for Investors
ROA helps answer a fundamental question: How efficiently is a company deploying its resources?
- Efficiency: A higher ROA indicates that a company is generating more profit relative to its asset base, which is crucial in determining operational effectiveness.
- Comparability: Particularly valuable in asset-intensive sectors like banking and insurance, where ROA acts as a standardized efficiency yardstick. Since these businesses rely heavily on assets (e.g., loans, investments, reserves) to generate income, small changes in ROA can have meaningful implications.
- Profitability Lens: Unlike metrics that focus solely on the income statement (like operating margin), ROA incorporates both profitability and asset utilization by blending data from the income statement and balance sheet.
- Strategic Insight: Useful for identifying high-performing, asset-heavy companies with strong capital allocation discipline, or spotting lean, asset-light firms achieving outsized returns with minimal resources.
Capital Allocation Clarity: ROA can reveal how well a company is deploying incremental capital. Businesses that maintain or improve ROA while growing asset bases often exhibit disciplined reinvestment strategies.
Key Considerations When Using ROA
While ROA is a valuable indicator of operational efficiency, interpreting it effectively requires context. Several underlying factors can influence how ROA appears on the surface, making it essential to evaluate the number thoughtfully and relative to the business model and reporting framework.
- Industry Norms: ROA varies significantly by sector. Capital-light businesses such as software or services may show very high ROAs, while capital-intensive industries like utilities, telecommunications, and airlines tend to report much lower figures due to their substantial fixed asset bases.
- Capital Intensity: Industries like manufacturing, infrastructure, and transportation require heavy investment in physical assets. Even well-managed firms in these sectors may have modest ROAs, which doesn’t necessarily indicate poor performance but reflects the nature of their business models.
- Timing Adjustments: ROA should be calculated using the average of beginning and ending total assets for the period. Using only year-end values can distort results, especially if the company underwent significant asset acquisitions or disposals.
- Accounting Differences: Variations in accounting standards (e.g., IFRS vs. GAAP) can significantly affect asset reporting. Depreciation schedules, impairment policies, and lease accounting treatments may alter asset base calculations and influence ROA comparability across firms or geographies.
- One-Time Events: Gains from asset sales, write-downs, or restructurings can skew net income temporarily, affecting ROA in ways that may not reflect sustainable business performance.
ROA vs. Other Profitability Metrics
| Metric | What It Measures | Formula |
| ROA | Net income generated per $1 of assets | Net Income / Avg. Total Assets |
| ROE | Return on equity capital | Net Income / Shareholders’ Equity |
| ROIC | Return on invested capital | NOPAT / (Equity + Debt – Cash) |
| Gross Margin | Profitability before operating costs | (Revenue – COGS) / Revenue |
Real-World ROA Examples
Understanding how top companies perform on ROA offers valuable perspective. Here are three well-known firms across sectors, each illustrating different ROA dynamics:
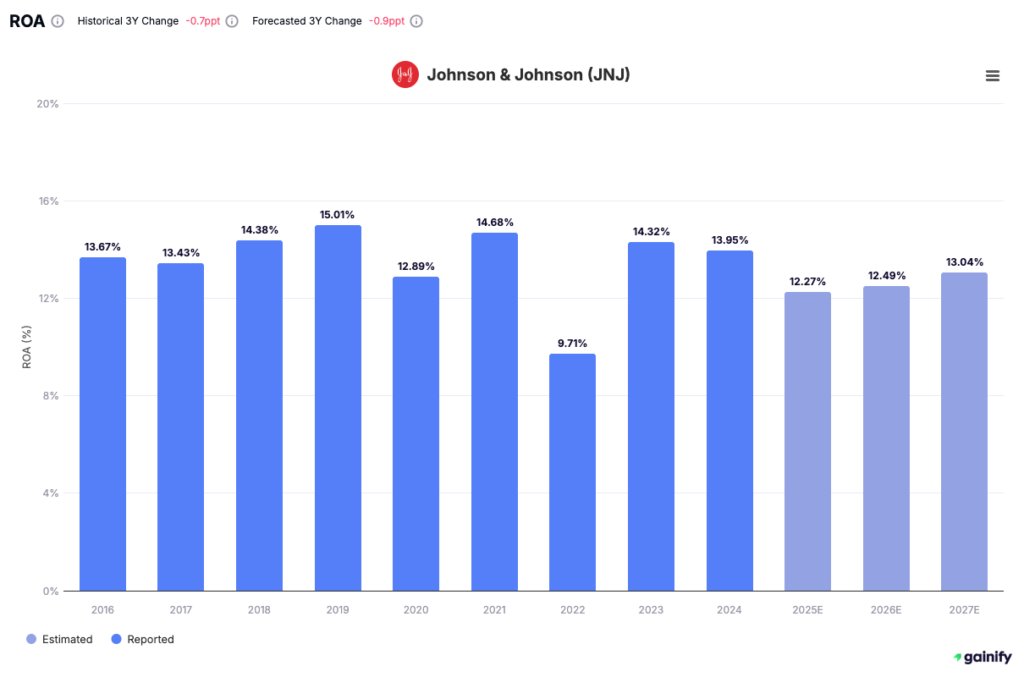
- Johnson & Johnson (JNJ): ROA ~12–13%
Solid performance driven by diversified, high-margin healthcare and consumer products. Reflects steady profitability in a moderately capital-intensive sector.
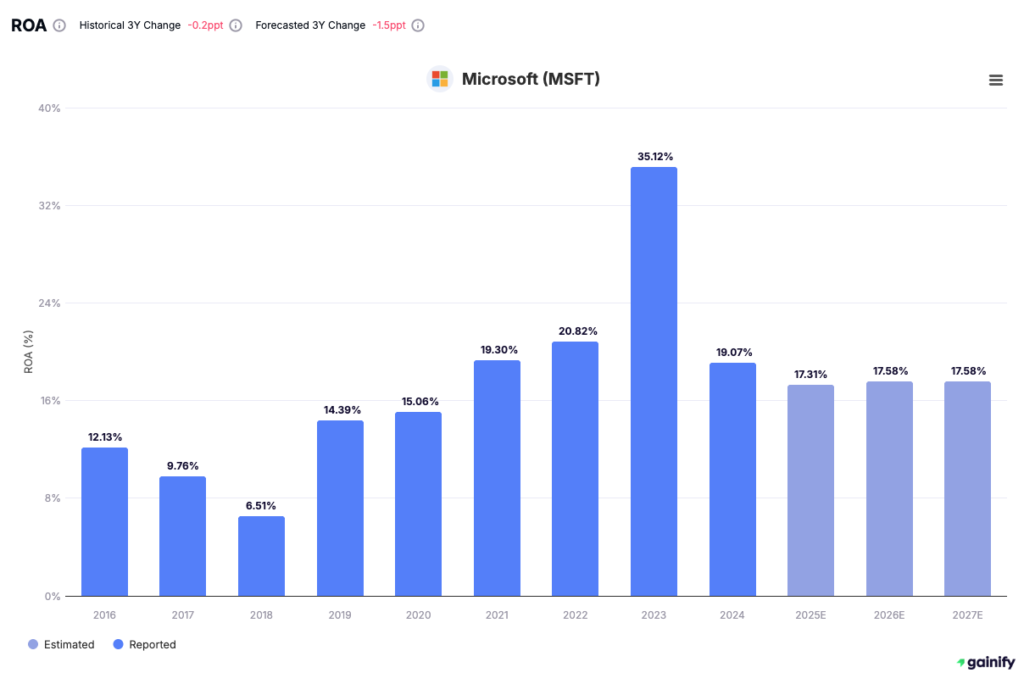
- Microsoft Corp. (MSFT): ROA ~18–21% – Exceptionally high ROA driven by its dominant position in cloud computing, enterprise software, and subscription-based services. Microsoft’s scalable, asset-light model enables it to generate strong returns on a relatively lean asset base.
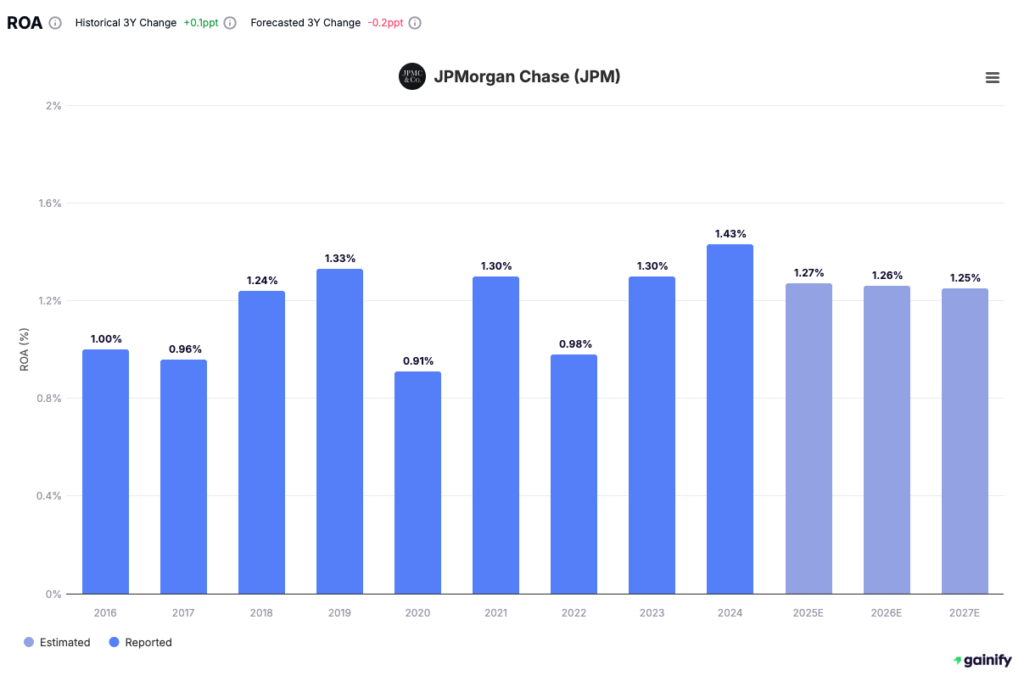
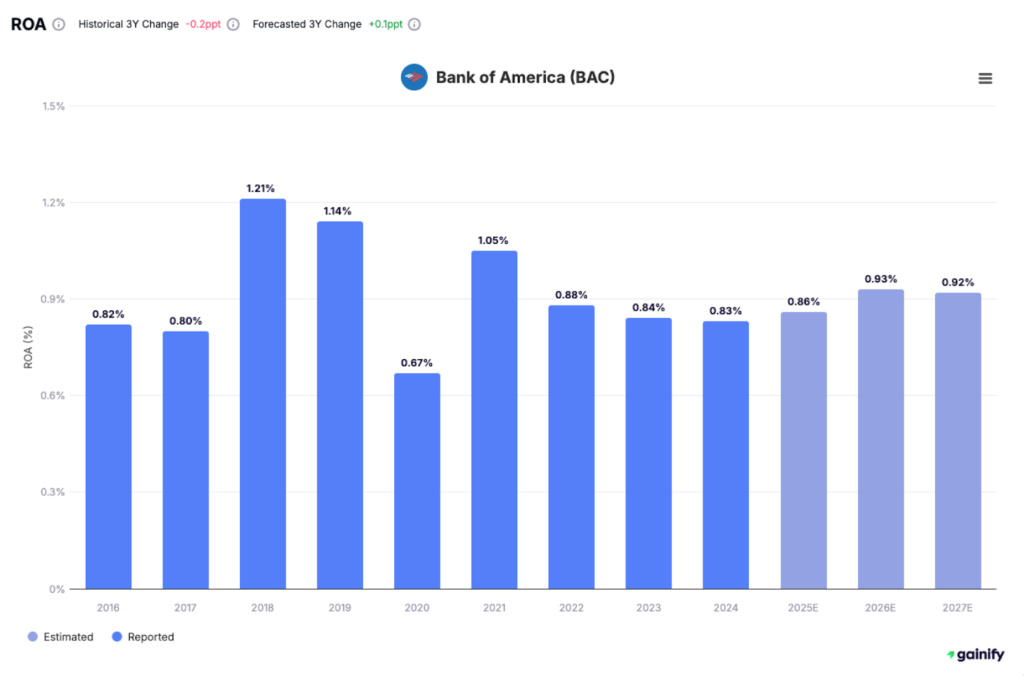
- Bank of America (BAC): ROA <1.0%
Low but typical for large banks operating in asset-heavy environments. Profits come from managing vast pools of loans, deposits, and investments.
These examples highlight how industry dynamics, business models, and margin structures all influence ROA and why it’s essential to evaluate the metric within the right context.
Final Thoughts: Using ROA in Investment Decisions
ROA isn’t just a number. It tells a story about how well a business converts resources into results. It should be used alongside other financial ratios and contextual industry knowledge.
Look for:
- Consistent ROA growth over time
- ROA trending better than industry peers
- Strategic asset-light models with high margins
By mastering ROA, investors can more confidently assess business quality, allocate capital, and uncover companies delivering high returns with smart resource management.