Return on Equity (ROE) is a key financial metric that tells you how effectively a company uses the money shareholders have invested to generate profits. In simple terms, ROE measures how much profit a company earns for each dollar of shareholder equity. Generally, the higher the ROE, the more efficiently management is using equity capital to grow the business.
But what exactly is considered a “good” ROE? The answer depends on context – including the company’s industry, its use of debt, and its stage of growth. This comprehensive guide will explain ROE in clear terms, show how to calculate it, give examples of strong ROE figures, compare benchmarks across industries, and discuss how retail investors can interpret and use ROE in fundamental analysis.
What Is Return on Equity (ROE)?
Return on Equity (ROE) is a fundamental financial metric that measures a company’s ability to generate profits from its shareholders’ equity. In simpler terms, it tells you how effectively a company is using the capital provided by its investors to produce earnings
The formula for ROE is:

Where:
Net Income represents the company’s total earnings after all expenses, taxes, and costs.
Average Shareholders’ Equity is calculated by taking the equity at the beginning and end of the period and dividing by two. This smooths out fluctuations and provides a more accurate picture of how capital was used over the period.
For example, if a company earns $5 million in net income and has $40 million in average shareholder equity, the ROE would be 12.5% ($5 million / $40 million). This means the company generated 12.5 cents in profit for every dollar invested by shareholders.
ROE is typically expressed as a percentage and calculated on an annual basis. Using average equity rather than just the ending balance accounts for any changes in capital during the year.
At its core, ROE answers the question: “How effectively is this company using investor capital to generate profits?” A higher ROE suggests greater efficiency and profitability, signaling that the company may be a strong steward of shareholder capital. For retail investors, a consistently high ROE can be a hallmark of high-quality management and a potentially attractive investment opportunity.
What Is a Good ROE?
Understanding what constitutes a “good” Return on Equity (ROE) requires more than just knowing the number itself-it demands context. ROE should never be evaluated in isolation. The definition of a “good” ROE varies significantly across industries, sectors, and business models. What’s considered strong in one industry might be average or even poor in another.
Why Industry Benchmarking Matters
Industries differ in their capital requirements, regulatory constraints, and profitability profiles. These structural differences have a direct impact on what qualifies as a good ROE:
- A 10 percent ROE may be excellent in insurance or regional banks, where high capital requirements and regulation constrain returns.
- The same 10 percent would be subpar for software or asset-light retail, where companies can scale more easily and face fewer capital limitations.
Benchmarking ROE against the industry average ensures that comparisons are fair and meaningful. Comparing across unrelated industries will give you misleading signals.
ROE Benchmarks by Industry
The following table highlights average ROEs across selected industries to show what good looks like in the right context (Jan 2025):
High-ROE Industries (20 percent and above):
- Hospitals/Healthcare Facilities: 76.1%
- Semiconductor Equipment: 31.8%
- Financial Services (Non-bank): 31.6%
- Software (System & Application): 27.7%
- Household Products: 26.2%
Moderate-ROE Industries (10 to 20 percent):
- Business & Consumer Services: 18.3%
- Transportation: 17.3%
- Air Transport: 13.3%
- Brokerage & Investment Banking: 13.11%
- Aerospace/Defense: 12.0%
Low or Negative ROE Industries:
- Chemicals (Specialty): 7.8%
- Banks (Regional): 6.8%
- Insurance (General): 5.6%
- Publishing & Newspapers: 4.2%
- Green and Renewable Energy: -11.57 percent
Why Peer Comparison Is Essential
Evaluating ROE only makes sense when comparing it to companies in the same industry. For example:
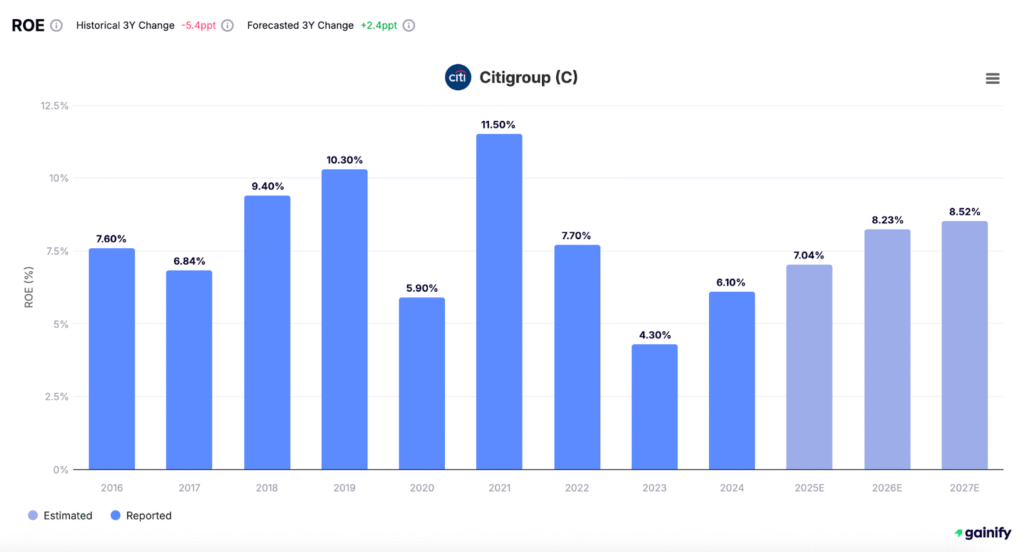
- Citigroup reported a 6.1% ROE, well below the banking industry average of 11.5%. This underperformance points to inefficiencies in capital use.
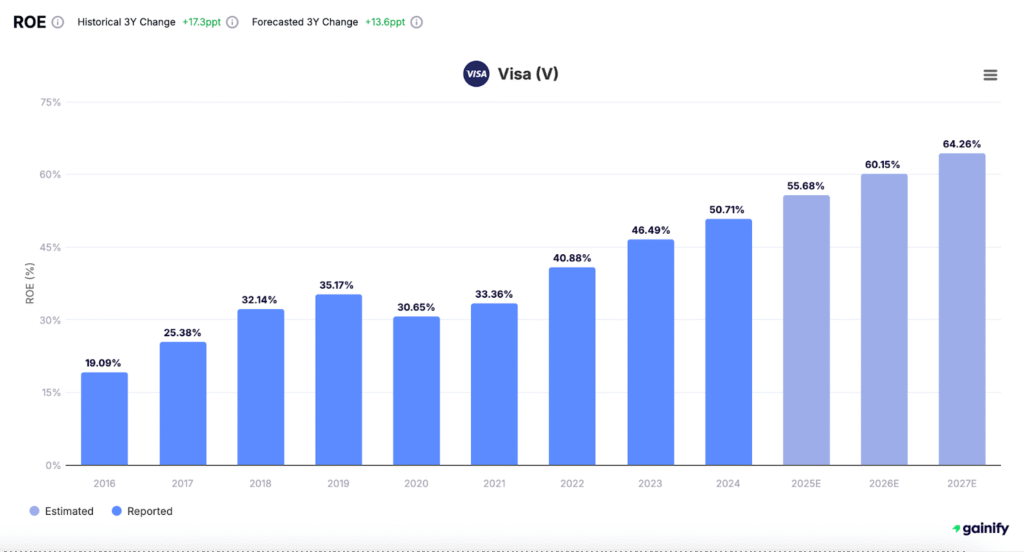
- Visa, by contrast, consistently delivers ROEs above 50%, far exceeding the global bank financial services average of 31.6%. That kind of outperformance signals operational excellence.
Outperforming your industry average is a key sign of strong management, capital discipline, and sustainable business advantages.
Real-World Examples of Strong ROE Companies
To make ROE more concrete, let’s look at a few real companies and their return on equity. These examples illustrate what high ROE looks like and how it can vary:
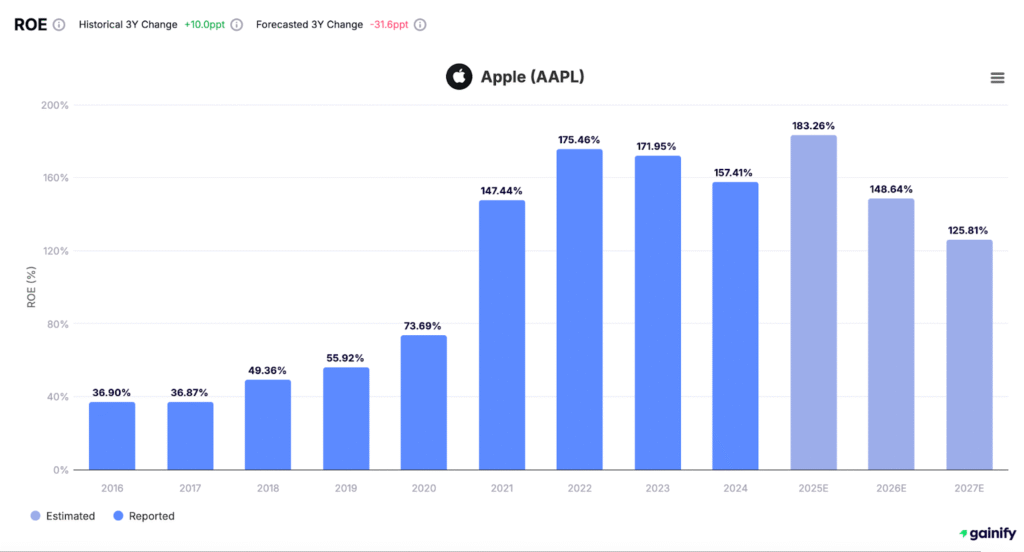
- Apple Inc. (AAPL) – ROE >150%. Apple has consistently delivered an extraordinarily high return on equity, peaking above 180% in 2024 and averaging well over 150% between 2021 and 2024. This level of performance is a direct reflection of Apple’s business model: highly profitable, asset-light, and built around high-margin hardware and recurring software and services. Apple’s dominance in consumer technology, coupled with minimal capital requirements compared to industrial firms, enable Apple to produce large profits relative to its equity base. While capital return strategies such as buybacks do amplify ROE, the core driver remains Apple’s operational excellence and scalability.

- Visa Inc. (V) – ROE ~50%. Visa consistently delivers one of the highest returns on equity among large-cap financial firms. As of 2024, its ROE surpassed 50%, with steady upward momentum forecasted through 2027. This performance is no coincidence. It reflects the inherent strength of Visa’s business model. As a global payments network, Visa operates in an asset-light, transaction-driven ecosystem. This model drives high operating leverage, strong profit margins, and modest capital needs – all of which translate to exceptional ROE.

- Citigroup Inc. (C) – ROE ~6–8%. Citigroup has historically delivered more modest returns on equity compared to its big-bank peers, and recent years have continued that trend. In 2023, Citi’s ROE dropped to just 4.3%, significantly below the U.S. banking industry average of ~13.5%. While forecasts suggest gradual recovery toward 8.5% by 2027, the bank remains a laggard in capital efficiency. Unlike asset-light or fee-based models, Citigroup operates a globally complex, capital-intensive business with significant exposure to emerging markets and regulatory constraints. These factors have long weighed on its ability to convert equity into high returns, despite having a sizable global footprint.

These examples show that strong ROE numbers can range from the mid-teens up into the double or even triple digits, depending on the company and industry. As an investor, you should note not just the absolute number but also how the company achieved that ROE (through genuine profit growth, efficient asset use, high leverage, share buybacks, etc.). A very high ROE warrants digging deeper to see if it’s sustainable. Conversely, a lower ROE at a stable company could either signal a conservative, capital-intensive business or a potential inefficiency. In any case, real-world ROE figures give a sense of what’s achievable: world-class companies often sustain ROEs well above 15%, and consistently high ROE is often a hallmark of a quality company.
The DuPont Breakdown: What Drives ROE?
The DuPont formula is one of the most effective tools for understanding how a company generates its Return on Equity (ROE). Rather than looking at ROE as a standalone number, DuPont breaks it into three core components:
ROE = Net Profit Margin × Asset Turnover × Financial Leverage
Each of these factors tells a different story about a company’s performance. By analyzing them individually, investors can assess whether high ROE is the result of strong business fundamentals or aggressive financial strategies.
1. Net Profit Margin (Net Income / Sales)
This measures a company’s profitability – how much of each dollar in revenue is turned into profit after all expenses. A higher margin indicates that a company has pricing power, cost control, or both. For example, premium brands or companies with strong competitive advantages often post high profit margins. On the other hand, highly competitive or commoditized industries may operate with thin margins.
High net profit margin contributes directly to a higher ROE by increasing the numerator (net income) in the ROE formula. However, a company can have strong margins and still show average ROE if it’s not efficiently utilizing assets or equity.
2. Asset Turnover (Sales / Assets)
Asset turnover measures how efficiently a company uses its assets to generate revenue. It reflects operational effectiveness: how well a company turns its investments in plant, inventory, and equipment into sales.
A high asset turnover means the company is squeezing more revenue from every dollar of assets. Retailers like Walmart, for instance, often have high asset turnover due to high sales volume and relatively low asset intensity. In contrast, industries like energy or utilities may have low asset turnover due to large infrastructure needs.
If two companies have similar margins, the one with better asset turnover will post a higher ROE. This metric rewards lean, efficient operations.
3. Financial Leverage (Assets / Equity)
Financial leverage indicates how much debt a company is using to finance its assets. It shows the relationship between total assets and shareholder equity.
Leverage can boost ROE because it reduces the equity base. If a company earns consistent profits but has a smaller equity base due to higher borrowing, its ROE will rise. This can be a positive if the company is using debt prudently to grow. However, excessive leverage increases financial risk, especially in downturns.
This component should always be analyzed in tandem with the company’s debt levels. A high ROE driven by leverage is less sustainable and more vulnerable to interest rate changes or economic shocks. The best companies generate strong ROE with moderate or low leverage.
Bottom Line
The DuPont breakdown transforms ROE from a single output into a powerful diagnostic tool. It helps investors understand whether a company’s strong ROE comes from high margins, efficient asset use, or leverage.
ROE Red Flags: When High Returns Can Be Misleading
A high Return on Equity (ROE) often signals financial strength, but not always. Without proper context, a high ROE can give investors a false sense of security. In fact, several factors can inflate ROE in ways that don’t reflect real operational performance. Here are key red flags that may make a strong ROE misleading.
A. Excessive Leverage Masking Risk
A company with a small equity base and large debt can report a very high ROE, even if its actual profits are modest. The math is simple: ROE = Net Income / Equity. When equity is artificially low because the company has taken on heavy debt, the ROE numerator (net income) doesn’t need to be that large to produce an impressive percentage.
This type of financial engineering can make a business look far more efficient than it really is. But high leverage increases risk. If earnings fall even slightly, the company could struggle to service its debt. Always check the debt-to-equity ratio alongside ROE. If a company’s debt is many times larger than its equity, a sky-high ROE may be a red flag, not a green one.
B. Share Buybacks Reducing Equity
Stock buybacks can boost ROE without improving the core business. When a company repurchases its own shares, it reduces shareholders’ equity. If net income stays constant while equity shrinks, ROE rises.
Buybacks can be a smart way to return capital to shareholders, especially for mature companies with limited reinvestment opportunities. But they can distort the true picture. In extreme cases, aggressive buybacks over time can reduce equity to near zero.
Before taking a high ROE at face value, check whether the company has been heavily repurchasing shares. A rising ROE from buybacks doesn’t necessarily reflect stronger earnings power. It may just reflect financial optics.
C. One-Time Gains and Accounting Adjustments
Sometimes a high ROE is inflated by temporary or non-operational events. These could include:
- Selling a business unit at a large gain
- Recognizing deferred tax assets
- Writing down assets, which reduces equity and boosts ROE mechanically
These events can make a weak year look strong or create a one-year ROE spike that isn’t sustainable. Always examine the footnotes in financial reports to identify whether ROE was affected by one-time or accounting-driven items.
D. Low Equity from Past Losses
If a company has experienced past losses, it may have a small equity base. When it returns to profitability, even modest earnings can produce an inflated ROE. This is particularly common in cyclical industries.
In some cases, this could signal a genuine turnaround. But it also suggests the company may be operating with a thinner financial cushion, leaving less room for error in future downturns.
Watch for: Whether the high ROE is a sign of recovery or simply a math-driven effect of past losses. Check the full balance sheet and recent income trends.
Conclusion
Return on Equity (ROE) is one of the clearest indicators of how efficiently a company generates profit from shareholder capital. For retail investors, it offers a fast yet powerful lens into a company’s business quality and capital effectiveness.
But ROE is only useful when understood in context. A “good” ROE isn’t a fixed number. It’s one that exceeds the company’s industry benchmark and reflects true operational strength. However, the source of those returns matters.
When ROE is high, ask:
- Is it driven by strong margins and efficient asset use?
- Or is it inflated by high leverage, aggressive buybacks, or one-time accounting gains?
Used correctly, ROE can be a shorthand for quality. Companies that consistently generate high ROEs from core operations, without taking on excessive risk, are often the ones best positioned to compound value over time. But no single metric tells the full story. ROE should be part of a broader toolkit, paired with debt analysis, cash flow, and an understanding of competitive dynamics.

